
 Log In


Inventory Management Template
Track current inventory by managing shipments and orders.
Just getting started? Register for our weekly Knack 101 webinar

Leverage Knack AI to expedite your new app with just a few sentences and save hours of time.

Safeguard data, control access, and ensure robust system reliability for peace of mind.

Organize, import, and manipulate data efficiently to make informed decisions and drive success.

Integrate data and workflows to enhance productivity and expand functionality effortlessly.

Analyze data, create charts, track performance, and make data-driven decisions with ease.

Control permissions, grant or restrict access, and ensure data security effortlessly.

Sell products, manage inventory, and process payments smoothly for your e-commerce business.
Design your app with the best experience for your users and appearance for your brand.

Automate data handling, trigger notifications, and simplify actions for efficient operations.
Effortlessly build forms to collect data, leads, orders, and more.
Expedite your app build with a pre-built template.

Discover valuable insights and tips.
Read Knack success stories.

Download and use a spreadsheet template.

Watch testimonials, tutorials, & expert reviews.

See why Knack is the best option.

Find an expert to build or expand your app.

Learn about how to set up and expand your app.

Find comprehensive guides and documentation.

Discuss your build with other Knack builders.

A handy reference for common terms used in the Knack platform and the no-code world.

Increase your revenue with Knack.
Get hired to build and expand apps.

Resell Knack apps to clients.
Leverage Knack AI to expedite your new app with just a few sentences and save hours of time.
Safeguard data, control access, and ensure robust system reliability for peace of mind.
Organize, import, and manipulate data efficiently to make informed decisions and drive success.
Integrate data and workflows to enhance productivity and expand functionality effortlessly.
Analyze data, create charts, track performance, and make data-driven decisions with ease.
Control permissions, grant or restrict access, and ensure data security effortlessly.
Sell products, manage inventory, and process payments smoothly for your e-commerce business.
Design your app with the best experience for your users and appearance for your brand.
Automate data handling, trigger notifications, and simplify actions for efficient operations.
Effortlessly build forms to collect data, leads, orders, and more.
Expedite your app build with a pre-built template.
Discover valuable insights and tips.
Read Knack success stories.
Download and use a spreadsheet template.
Watch testimonials, tutorials, & expert reviews.
See why Knack is the best option.
Find an expert to build or expand your app.
Learn about how to set up and expand your app.
Find comprehensive guides and documentation.
Discuss your build with other Knack builders.
A handy reference for common terms used in the Knack platform and the no-code world.
Increase your revenue with Knack.
Get hired to build and expand apps.
Resell Knack apps to clients.


Our visual builder allows you to create a web app that suits your exact workflow.
Your team understands your business challenges better than anyone. Now they can solve them—without writing a single line of code.
With Knack’s no-code web app builder, you can create data-rich applications such as SaaS apps, client portals, and internal tools for business processes or online member communities.

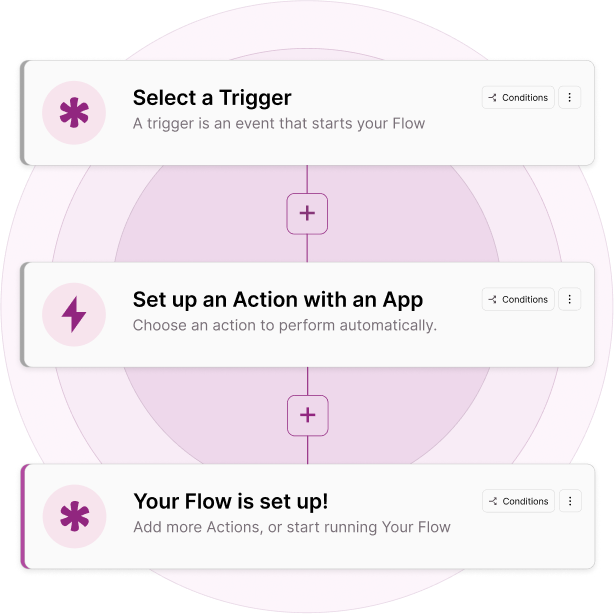
Knack’s automation features let you streamline repetitive tasks within your DIY no code database app builder.
With Knack, everything lives under one roof. Your team builds the solution once, and every component—forms, workflows, reports, user interfaces—updates are included in a single, coherent system that works the way you do.
Our visual builder makes the journey from concept to working application dramatically shorter, while we handle all the technical infrastructure behind the scenes.


Knack offers one subscription that covers your entire workflow. Users, clients, partners, or team members can be added without extra per-seat fees.
View the top 10 templates to link to in this view:

Knack plugs right into the tools you already rely on with minimal friction and integrates with over 500 apps to automate cross-platform tasks.


“Knack is instrumental in the daily running of the business. It literally runs every facet of our company, from front to back – top to bottom. In the beginning, it probably took me three or four days to build out a new section. Now I can build something new in under an hour”

“We don’t need a full support team or stack of engineers. For some issues, if someone comes to us and has a problem, Knack takes care of it, and that’s it. That’s a huge, huge benefit.”

“The speed of development with Knack was really critical for what we needed, With other programs, even if the features were there, it took more work, you could accomplish the same thing with fewer clicks.”